CONTACT
Back
  • Application Solutions

  • Oil and Gas Processing Solutions
  • Oil and Gas Production
  • Sustainable FPSO
  • Subsea Production
  • Terminal and Storage Facilities
  • Underground Gas Storage
  • Carbon Capture Utilization Sequestration
  • LNG Solutions
  • Geothermal Steam Management and ESPs
  • Renewable Natural Gas

OFM

The latest OFM release for new and exciting solutions

New release available now 

Strengthen your production analysis with the latest OFM release

With our users facing unique challenges around the globe – we’re always looking for new ways to refine and enhance our OFM software. Making it more intuitive, intelligent, and insightful than ever before. 

Active OFM license holders can download the latest release now.

Download OFM


New release now available

Our latest release is now available, bringing you new and enhanced solutions for improved efficiency and productivity, while maintain the technical depth and user flexibility OFM is known for. 

OFM 25.1 Software Release Announcement 

OFM 23.3 Software Release Announcement 

OFM 23.1 Software Release Announcement 

OFM 21.2 Software Release Announcement 

Active OFM license holders can download now 

Download OFM latest release

OFM 25.1 Summary

  • New Well Log Analysis 
  • New File Viewer & File Manager 
  • Mapping & Charting Updates
  • Comprehensive Analysis
  • Flexible Workflows

Latest enhanced features

New in OFM 25.1

New Well Log Analysis 

  • A new Well Log viewer has been added to the Analysis Dashboard, supporting Well Log analysis, multi-well comparisons, and Log Report formats. Users can customize trace colors and chart properties such as cutoffs, shading, and axis settings using the Property Inspector. Log data can be imported as *.log files and the multi-well log enables side-by-side trace visualization across multiple wells.

 New File Manager 

  • The new File Manager provides a streamlined interface for importing and managing PDF documents within OFM. It includes tabs for batch import, single file import, and file deletion, making it easier to organize supporting documentation for analysis workflows. 

 New File Viewer 

  • The File Viewer enables users to display imported PDF documents directly in the Analysis Dashboard. This feature supports integration of well reports, diagrams, equipment designs, and other workflow-related content, enhancing context and collaboration.


Dashboard Mapping, Charting, and Reporting

  • Add regression curves to line charts with tooltip display of curve equations and R² values.
  • Volumetric Oil Mapping now supports unique or shared control points across layers, with individual grid layer calculations before final volume estimation. 

Export Update

  • File Preview is available in the Analysis Dashboard Export tool, allowing users to preview their data export including a structured grid display for CSV files.

OFM 25.1 Software Release Announcement

New in OFM 23.3

New Surface Map Visualization 

  • A new Surface Map visualization has been added to the portfolio of Dashboard analyses, bridging the gap between Classic OFM analyses and the Dashboard options. The Surface Map is also available as a pop-up window in the standard Grid Map analysis. 

New Export Spreadsheet  

  • A new Export Spreadsheet functionality is now available. This export tool provides a simple user interface for preparing and exporting CSV files and formats designed specifically for PetrelTM for improved integration with OFM. 

Mapping and Charting Updates 

  • Multiple control points can now be added in Grid Maps, Contour Maps and in the Volumetrics_Oil (OOIP) layer. 
  • New option available for shifting a line chart curve in time (x-axis displacement). 
  • Send to Excel option added to the right-click menu for Box Charts.


Other Updates 

  • Added option to select Type Curves in a Variable Selector for a Report. 
  • Additional options for Length and Area units are now available in the Pattern Manager. 
  • New option in forecasting to combine Y-axes for multiple variables, including variables with different units. 

OFM 23.3 Software Release Announcement

New in OFM 23.1

New Box Plot Analysis

A new Box Plot Analysis has been added to the portfolio of Dashboard visualization. Also called a Box-andWhiskers Plot, this plot provides a good visual of the data distribution of a dataset. 

New Forecast Variance Report

The new Forecast Variance report compliments the three Forecast Manager options introduced in 2021: Display Saved Forecasts, Run Auto Forecast, and Update End Rate/Ratio. The Forecast Variance report provides a quick and easy way to view and highlight the differences between forecasted and actual production for a group of completions. 

Dashboard Forecast Analysis

  • New Fill Under Curve option 
  • Digitize Points functionality now available 
  • Enhanced Lasso functionality for point selection of multiple phases 
  • Exponential Equation now available in the summary table

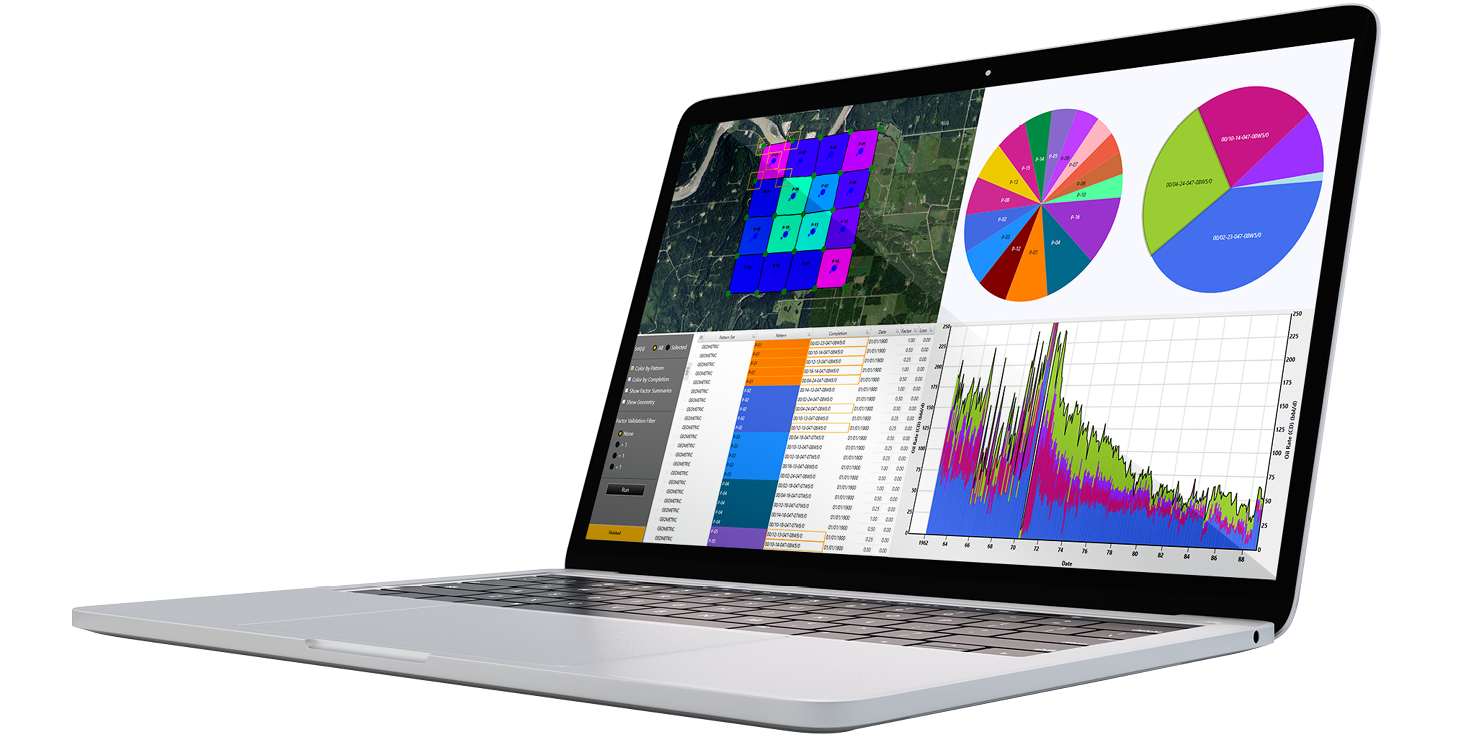
Dashboard Mapping, Charting and Reporting 

  • Added option to display faded completions in Mapping 
  • Voronoi table now linked to the Voronoi Grid and Navigation Panel 
  • Bubble Maps can now be scaled to map units 
  • Display Events and Notes from linked tables in Dashboard Analysis 
  • Date Range added as Date filter in Reporting

OFM 23.1 Software Release Announcement


OFM dashboard with the Pattern Manager, Mapping, and Charting


For more information please contact us

Your details
*required
Areas of interest (tick all that apply)
Please indicate your region: